Demo Overview

Exploring the opioid epidemic with GPU accelerated analytics and visualization.

With the latest addition to our public demos, we have the absolutely spectacular 1.2 billion row taxi/limo/uber/lyft dataset from NYC. The dataset is comprised of staggering detail (full GPS, transaction type, passenger counts, timestamps) from January 2009 through June 2015 (essentially the birth of rideshare).

Who would have thought that analytics would become the bottleneck in the modern organization?

The Finovate show one of the best, most dangerous shows in any industry and is the crown jewel of the FinTech event calendar. Its one of the best because of its rigorous selection process coupled with a hyper-engaged, highly informed audience.

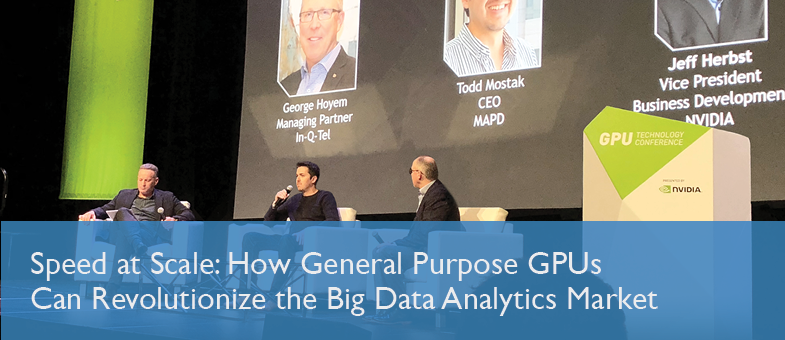
Learn why GPUs are the future for general purpose analytics.

The rise of modern business intelligence (BI) has seen the emergence of a number of component parts designed to support the different analytical functions necessary to deliver what enterprises require.

The old cliché that records are meant to be broken certainly applies to the tech industry. They‘re milestones that reset the bar for what’s possible but more importantly serve as a barometer of where things are headed.

Organizations are visualizing and exploring data in ways we once only associated with science fiction films.

There are many reasons why analyzing energy market data is more difficult, and more important in today’s global economy than in the past. In the US, we have gone from being a net consumer of oil and gas to the largest producer in the world.

Meddle is a data integration platform, powered by OmniSci, that pin-points gentrifying neighborhoods in New York City to help drive more informed policy and investment decisions


