

Announcing OmniSci 4.7
Try HeavyIQ Conversational Analytics on 400 million tweets
Download HEAVY.AI Free, a full-featured version available for use at no cost.
GET FREE LICENSEHeading into the summer, we’re very happy to announce the release of OmniSci 4.7, which represents another incredible effort by our engineering organization to deliver key capabilities across the platform to our users and community.
While we’ll dive into the details of the release shortly, it’s important to first share a quick note on OmniSci’s evolving direction. We are often thought of as a data visualization tool because of OmniSci Immerse, or alternatively, a database built to run on GPUs (OmniSciDB). While these descriptions serve as helpful guideposts for getting familiar with our platform (and are true in a literal sense), they fall quite short of capturing both the range of OmniSci’s usability, as well as the consistency in the experience, not to mention the set of capabilities going well beyond SQL and BI that we are planning for the platform in the near future.
Here is an early preview of OmniSci running on ADS-B telemetry data - a streaming spatiotemporal dataset of global flight activity. We invested in gathering this dataset to showcase the power of the latest NVIDIA GPUs, and are up to 14.5 billion records over just a couple of months, growing at the rate of 150 million observations a day. All of this is running on a single server with 8 Turing-class GPUs, with 384GB of High Bandwidth Memory. Stay tuned for much more on this dataset in the coming weeks!

At the opposite end of the scale, an often-overlooked aspect is OmniSci’s ability to scale down while still exploiting all of the available hardware performance. In contrast to the scale of the ADS-B dashboard above, here is Immerse again, minus GPU-based rendering capabilities working on a dual-core (yes, a total of 2 cores!) MacBook Pro from 2017 with just 16GB DRAM analyzing 55 million shipping manifest records from the publicly available US Bill of Lading Summary dataset between 2017 and 2018. (Speaking of which, you can now install OmniSci’s open source edition on your mac or linux laptop with conda using conda install -c conda-forge omnscidb-cpu.)

If there’s anything that is consistent across these experiences, it is the level of interactivity at any scale that is unique to OmniSci. In the first case, OmniSci exploits the power of the latest Turing GPUs, and in the second, it can still clearly take advantage of whatever performance a 2-year-old CPU-based system can provide. This performance at scale continues to be a bedrock differentiator for us.
What we have also learned in observing and talking with our customers is that they don’t just view the OmniSci platform as purely for SQL and visual analytics, but as a single platform that accelerates complete workflows, particularly those involving spatiotemporal analytics at scale. For these use cases, OmniSci is increasingly seen as a one-stop shop for the entire journey from data acquisition and ingestion through to creating data products (e.g. exploratory dashboards in Immerse, or more special-purpose applications).
We also found that within these workflows, a common emerging need is to quickly integrate data beyond a single source dataset. Normally, this would be done through common SQL practices - either by setting up a star schema with explicit joins, for example, or creating a denormalized dataset across 2 or more sources. While this is still possible, a key emerging product theme for us in 2019 is to support this type of ‘Data Fusion’ at the level of the end user (rather than using data engineering). We’ll dive a lot more into this theme in subsequent product releases, including OmniSci 5.0, and through the remainder of the year - stay tuned!
With that context in mind, let’s dive into OmniSci 4.7 and all its major features.
OmniSci Immerse
The major highlight of OmniSci 4.7 is a powerful feature we’re calling Visual Data Fusion (VDF for short). After a major engineering push over the last few months, we have shipped the first iteration of this capability in 4.7.
VDF, simply put, gives users the ability to combine measures from multiple data sources on the same “combo” (line/bar) chart on a shared dimension (typically but not only time intervals), and also works with the crossfilter paradigm in Immerse. This is a natural complement to the existing multi-layer geospatial charts, which already allows chart layers to be built from different tables. Currently, each VDF source is a distinct table within the same database, but we plan to soon have it work across databases, and also be available on other chart types.
VDF allows for powerful analytic scenarios where users can overlay measures from different data sources in a single combo chart, and have them naturally work with crossfilter - e.g. stock prices and bond yields within the same week, shipping traffic and flight traffic within the same month, or packet capture data from internal and external sources over the same time interval (see the below dashboard for this example).
Another obvious use for this capability is where you can unify both retrospective and predicted values for a single measure, where you may have used an external forecasting tool (for example, Facebook’s Prophet) to do this prediction, and put the results back in a different OmniSci table. Finally, an even more common use case is looking at time-based data across different time horizons. For example, if you’re analyzing shipping traffic data for each year from 2016-2018, a natural approach may be to have 3 distinct but identically structured tables as separate sources, and use VDF to view the same measure across these 3 sources.
Getting started with VDF is simple; in 4.7, users will see the option to “Add Another Data Source” during the chart creation step of a new combo chart. From there, users can add as many sources as needed for their use case.
Adding the first source

Adding subsequent sources


In addition to VDF, Immerse in 4.7 now has the ability to filter on aggregates on the point map and scatter plot charts. This aggregate filter reduces visual noise, particularly on charts with a large number of geo-located entities where you may be computing measures of activity on each of them - for example, cell towers or Twitter users.
In the example below, the first screenshots reflects tweets coming from all individuals in the LA metropolitan area in May 2017. The second screenshot shows a filtered chart that limits what’s visualized to only those individuals with over 100 Twitter actions that month.
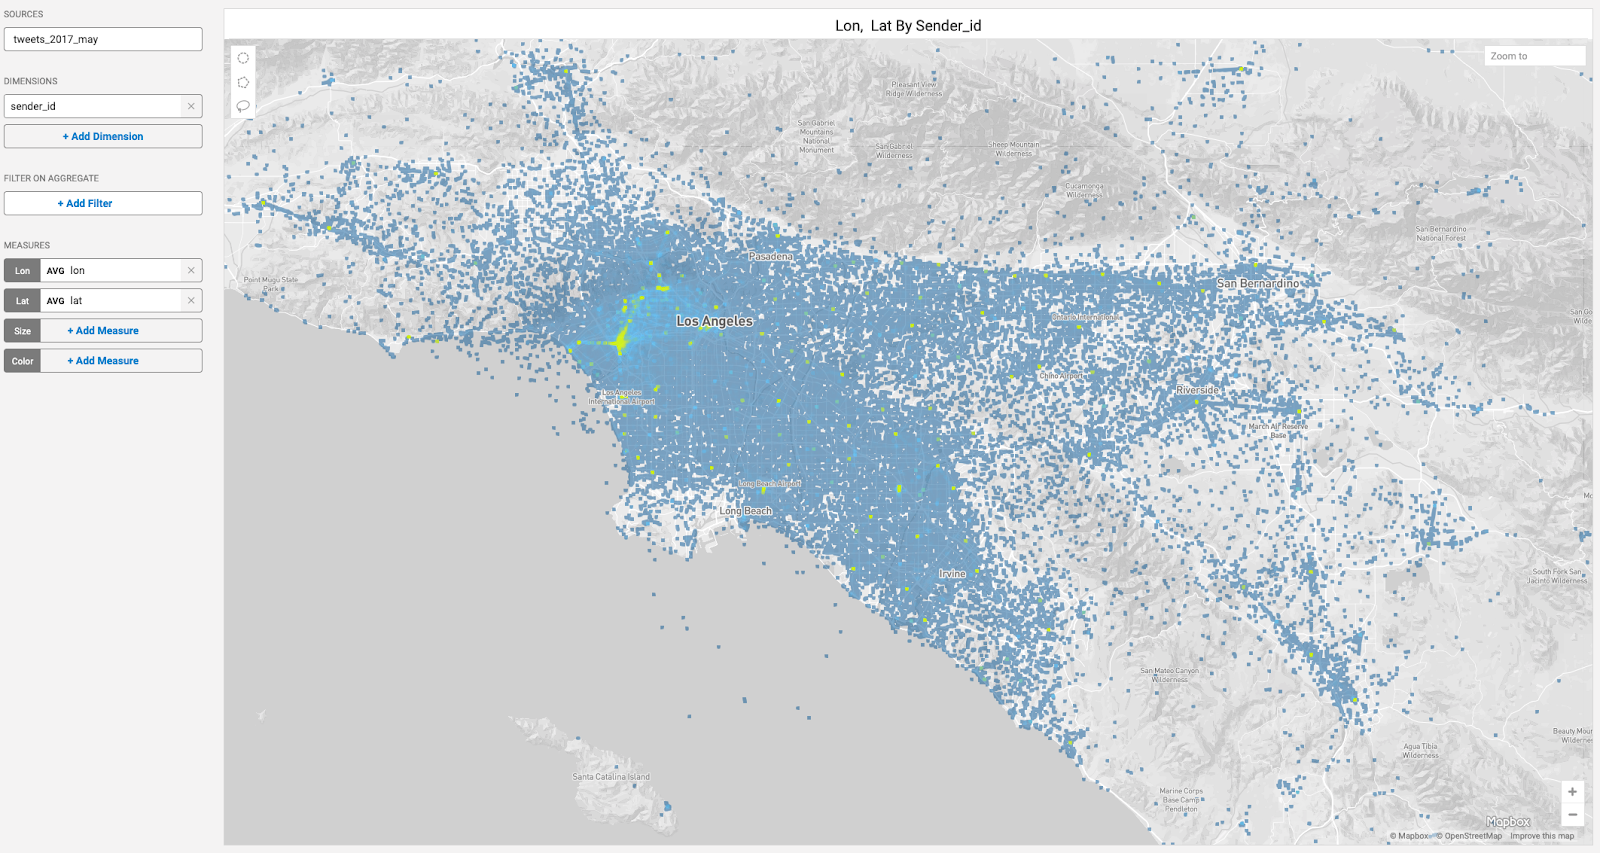
Tweets from all users in the LA metropolitan region in May 2017

Tweets from all users in the LA metropolitan region in May 2017 with over 100 tweets
OmniSciDB
OmniSciDB has several major features in 4.7 targeting our continued focus on performance and scalability, while also enabling users to take advantage of advanced SQL capabilities.
Starting in 4.7, we have added initial support for Window Functions. This is a long standing ask from several customers and community team members, and we are proud to announce an initial rollout of this key analytic SQL feature. Window functions such as LEAD, LAG, and NTILE are indispensable in performing comparative computations over rolling windows.
Here is an example from our documentation, of using Window Functions to perform a quantile (NTILE) computation over the flights dataset.
SELECT * FROM (
SELECT ntile(5) OVER (PARTITION BY airtime ORDER BY distance DESC) AS ranking,
airtime,
origin_name,
dest_name
FROM flights_2008_10k)
AS myQuery where distance < 140 ORDER BY ranking DESC ;
A few caveats to note: while several database and analytic engines support window functions, OmniSci’s unique challenges are related to supporting these in a way that is fast and scale to tens of billions of data points, which is still a work in progress. To begin with, we recommend that you run window operations ideally on post-aggregate results particularly when operating on very large datasets - that is, on group by query results rather than raw granular data. Please refer to the documentation for the currently supported list of window functions and share your feedback!
Another oft-requested feature is a common step used in the initial stages of the data acquisition/ingestion process, where customers are creating modified versions of staged data tables - e.g. you may want to roll up a per-second granular dataset into per-minute or per-hour rollups. While the CREATE TABLE AS SELECT command partially addresses this need, we’re happy to announce that OmniSciDB now supports INSERT TABLE SELECT (aka ITAS), where you can append data from a query result in-place to an existing table.
As always, we continue to work on performance and scalability as a foundational theme. OmniSciDB in 4.7 has some noticeable performance improvements across the board. When running queries against views, we now attempt to avoid materializing intermediate results as long as possible during execution. We found further performance improvements by allowing the ability to sort batches of rows at import time on a given column, which can lead to significant performance increases when joining or grouping on that column. Finally, we have a number of improvements in overall performance of joins.
On the SQL feature set, we now support domain-based authentication. This allows for a set up where both SAML and LDAP (or alternatively, OmniSci’s native) authentication can all be deployed together. If SAML authentication fails, and LDAP is configured, the system will now use LDAP. Alternatively, it will fall back to OmniSci authentication if configured this way. This eases the set up of system accounts for OmniSci where customers may find it difficult to register such accounts with their organization-wide directory service. In addition, we now support the ability to rename both users and databases.
We now support distributed rendering for polygons. This allows for much more scalable and performant geospatial rendering in distributed setups, and is a natural complement to the foundational work we landed in release 4.6 around in-situ poly rendering. At our recently concluded Product and Engineering Summit, our engineering team shared some amazing updates on the progress towards a new foundation for our Render engine - one that represents a quantum leap in performance and capability over our class-leading engine of today.
4.7 includes many other usability and product stability improvements. For a full list of features and fixes in the release, check out our release notes. For details on how to use them, please refer to the latest help docs. We look forward to hearing your feedback!
For new users, OmniSci 4.7 can be accessed through a variety of ways: download a pre-built version of our Open Source edition, sign up for our 30-day Enterprise Trial on our downloads page, or get instant access with a free 14-day trial by signing up for OmniSci cloud. On your mac or linux machine, installing the OmniSci Open Source edition is as simple as conda install -c conda-forge omnscidb-cpu.


