

Explore MapD Streaming Capabilities with IoT Devices
Try HeavyIQ Conversational Analytics on 400 million tweets
Download HEAVY.AI Free, a full-featured version available for use at no cost.
GET FREE LICENSEThe number of Internet of Things (IoT) devices is growing everyday. It’s estimated that there will be 30 billion devices by 2020. IoT devices can range from a complicated A/C thermostat to a small sensor on an assembly line.
We’ll show how MapD can work with IoT to visualize live data from sensors, which opens the door for endless applications.
To show an example of IoT sensors, we created 4 devices. Each device consists of an ESP8266 based board and a DHT11 temperature/humidity sensor. We also designed and printed a 3D case and cover because why not. The assembly costs around $5 each and with the built-in ESP8266, we get WiFi capabilities.

Each device is then coded to connect to Wifi and send an HTTP POST request every 5 seconds containing: room name, temperature, and humidity to a server. Now all that is needed for the device to run is just a 5v USB power source.

The devices are then plugged in to 4 different meeting rooms.
The code:

The server used in this example is expressJS server. But any other web server can be used. The server listens to the incoming requests and adds the data to a CSV file. The data includes timestamp, room name, temperature, and humidity.
The setup:
$ mkdir myServer
$ cd myServer
$ npm init
$ npm install --save express
$ npm install --save time-stamp
Create app.js:

Run the server:
$ node app.js
Or simply clone the repo and $ npm install then $npm start
The csv file is then streamed to MapD using the StreamImporter feature of MapD.

Before we can stream a file, we need to create a table for it in MapD. I used MapD Immerse importer to create the table. First we ran the server and the devices we created to get a few lines of data in the CSV file. Once we had at least one data entry, we dragged and dropped the file to Immerse importer.
After the file was uploaded, we adjusted the name and the data type for each column as well as the name of the data table.
Now to the streaming code:
$ tail -F file/to/be/streamed/log.csv | Mapd/Installation/Directory/bin/StreamImporter office_temperature_live -u -p --delim ',' --batch 10 --retry_count 360 --retry_wait 10 --null null --port
The parameters:
1- File to be streamed.
2- Path to StreamImporter.
3- Table to be streamed to.
4- Database name that has the previous table.
5- -u and the username for mapd.
6- -p and the password.
7- --delim is the delimiter between columns, comma in this case.
8- --batch is the number of new entries queued up locally before submitting a batch.
9- --retry_count is number of attempts before job fails.
10- --retry_wait is number of seconds to wait after server connection failure.
11- --null is the string that represent null value,ex: nan.
12- --port is the port number for MapD Core on host.
We have running devices that send their data to a server. The server then creates a file with the data received. The data is then streamed to a table that lives on MapD server.
Let’s put the data we are collecting to use with the power of MapD:
1- Open Immerse and log into the same user and database that has the table.
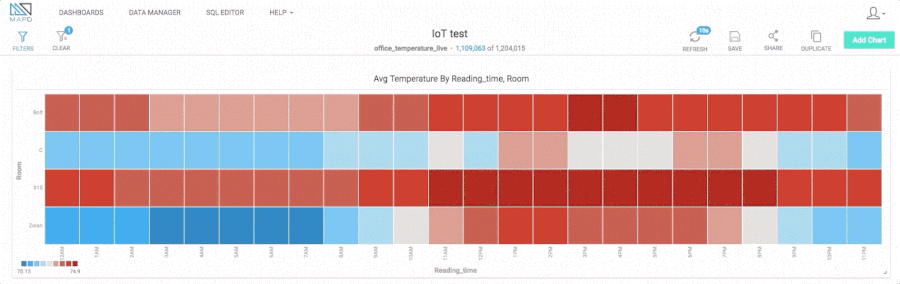
2- Create a heat chart: Reading time (extract by hour) vs Room.
3- The color dimension set to temperature.
4- Select the color gradient from Blue to Red as that suits temperature.
5- Click apply.
We get this chart:

But this chart is static. It only has the data from the table when the chart was created.
To grab the new data submitted after the creation of the chart, we can click on the “Refresh” button on the top right corner of the dashboard. Or even better we can use the “Auto Refresh” feature and set it to refresh every certain period. For testing purposes, let’s select 10 seconds.

This chart will grab the new data every 10 seconds and render it. You will also notice that the number of rows in the table are increasing.
Now we have a connection between an IoT device and a live MapD chart.
The applications of this setup are endless. A factory can have all the data from a production line streamed and visualized on MapD which can help the decision makers improve the process and drive more profit and higher quality production. A farm can have all the data streamed from temperature, humidity and soil moisture sensors and visualized to take the appropriate decisions for a higher, healthier yield. These are just examples of many applications to the setup shown above.
It’s also worth mentioning that after seeing the above chart and being able to prove that 2 of the rooms being tested have much higher temperatures than the rest of the office, our office manager, Irene, sent a picture of this to the building management and they sent an A/C technician to fix this problem. This is the power of data and the power of MapD.
Try it yourself:
Download Mapd:
https://www.mapd.com/platform/downloads
Code repo:
https://github.com/menaczar/MapD-IoT-test


