

How I Lost 50 Pounds with OmniSci
Try HeavyIQ Conversational Analytics on 400 million tweets
Download HEAVY.AI Free, a full-featured version available for use at no cost.
GET FREE LICENSEOmniSci is all about visualizing vast amounts of data to perform analysis at the speed of curiosity. It's thrilling to work with this technology every day.
But this post is not about billions of records or real-time analysis. This is about how 160 rows of data has helped me visualize a new version of myself, and kept me motivated to make permanent, positive lifestyle changes.

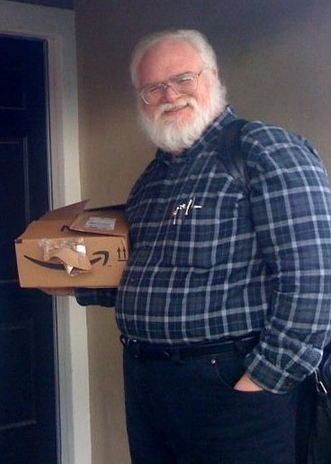
This was me, Christmas 2018. Not the boy in the bed. I'm the jolly one in the red jammies. I'm what's known as an RBS (Real Beard Santa). I like looking like Santa. At least when I'm wearing red clothes, people don't assume I'm a vagrant or an outcast from a biker gang.
While I was not uncomfortable with my weight, my eye doctor told me that my blood pressure was high, that I was in danger of developing glaucoma, and I needed to deal with it.
An annual checkup is vital, as we all know, so after several decades, I decided it was time to get one. Big mistake. My blissful ignorance was shattered by a series of numbers that were all way too high. My new doctor prescribed pills, and told me if I took them for the rest of my life, I might be there to live it.
I'm not a pills kind of guy. I always figured I was the kind of guy they interview at 110 who attributes his long life to cigars and whiskey. Instead, I'm the "watch out for too much sodium in your kale" kind of guy. I knew it was time for a change. On December 28, 2018, I decided to get serious about turning this all around.
Given my appreciation for gallows humor, I chose to follow the guidelines laid out in Dr. Michael Greger's book How Not to Die. He recommends keeping a food diary that includes the Daily Dozen food and exercise regimen. I'm a detail-oriented tech nerd, so this had to go into a Google sheet.

I gathered the daily results on a summary page to track progress. This isn't grokkable, though. I like grokkability. For that, I naturally turned to OmniSci. I started by exporting the table to CSV and loading the base data. To make it easier on a daily basis, I used a concatenation formula to create a SQL INSERT instruction for each new line.

I copied and pasted the insert instruction to the SQL Editor in OmniSci Immerse.

Once I had the data in OmniSci, I could visually track my progress on my Health Log dashboard.

My goal is to lose 2 pounds per week in 2019. The Projected Weight Loss is the smooth blue line in the first chart. The bumpy, jagged line is my actual weight as it jostles up and down, but mostly down, over days, weeks, and months.
I only report my minimum weight and blood sugar in the number charts, because I know if they creep up they'll drop back down soon enough. Focus on the positive.
I hate to see the drops and spikes when I miss a day of walking. So I’m pretty consistent. I use Google maps to visualize a virtual venture based on my total mileage. I just reached Tijuana, and now I'm heading up to Palm Springs.


I'm now halfway to my goal of losing 100 pounds this year. My blood pressure is normal (without medication), my A1C and cholesterol are way down. Importantly, I am now a (Piller-Belly Santa).
My data set is only 160 lines or so, but those numbers and visualizations have helped me to make a lasting change in health and wellness. Not your typical OmniSci use case, perhaps, but life-enhancing information can often be found in a small and targeted vanity dataset.
What discoveries might you make with your own private OmniSci?Download a free trial and see where it takes you. It might be the adventure of a lifetime!


