

OmniSci launches version 5.3 unlocking the power of self-service analytics at scale
Try HeavyIQ Conversational Analytics on 400 million tweets
Download HEAVY.AI Free, a full-featured version available for use at no cost.
GET FREE LICENSEThe last few months have been unprecedented for all of us (globally as well as at OmniSci) with COVID-19 defining the first half, and the ongoing protests and unrest closer to home these last few weeks. We have all needed (and taken) time and the mental space to both privately reflect on how these events affected us, from our families to our company and colleagues, to the larger communities and the countries we live in. We have also tried to find ways in which we could help, as a company. After all, it is times like these that put what we do in necessary perspective.
Through all this, our Product & Engineering teams have remained focused to push the OmniSci platform forward in a meaningful way for our customers. We’re happy to announce our next major release of the platform - OmniSci 5.3.
Release Highlights
OmniSci Immerse
Let’s take a look at some of the new features added to Immerse such as New Combo Charts, Cumulative Measures, Top N Values, Chart-level filters, Filter Panel Experience, and Intuitive Map Exploration.

1 - New Combo Charts
Why do we need new combo charts?
OmniSci charts use multiple engines such as mapd-charting, mapd3, etc. Building new chart types, adding interactivity & options to these frameworks is complicated, cumbersome and takes longer development cycles.
In order to quickly respond to customer requests, we decided to update the underlying charting foundation. We upgraded to Vega as our future charting engine. This will set us up for the future as it provides the velocity our customers expect in adding new chart types along with supporting a richer set of chart interactivity.
The new Combo Charts are the first major set of charts that use this foundation. Over the next several releases we will transition other charts to use this framework.
What are the new combo charts?
OmniSci 5.3 debuts a collection of new bar/column/line/area charts (aka ‘New Combo’) that bring about 16+ new chart types, richer interactivity, and simplified experience such as:
- Bar chart, Column chart, Line chart, Area chart
- Variations for horizontal (bar) and vertical (column) orientations
- Variations for side-by-side grouped bars, stacked bars, 100% stacked bars
- Measures as cumulative values and percentage distribution
- Multi-layered combo charts
- Filter for top N values
Let’s visit some of these features in detail.
1 - Bar chart (horizontal), Column chart (vertical), Line chart & Area chart

The new combo chart provides the flexibility of visualizing your data as horizontal bars, vertical columns, line or area by simply selecting an option in the chart editor.
2 - Grouped, Stacked, and 100% Stacked bar/column/line/area charts

Bar charts with additional group-by-dimension can be visualized as grouped, stacked and 100% stacked charts. This allows for both binned and categorical values on the X Axis unlike the older stacked charts.
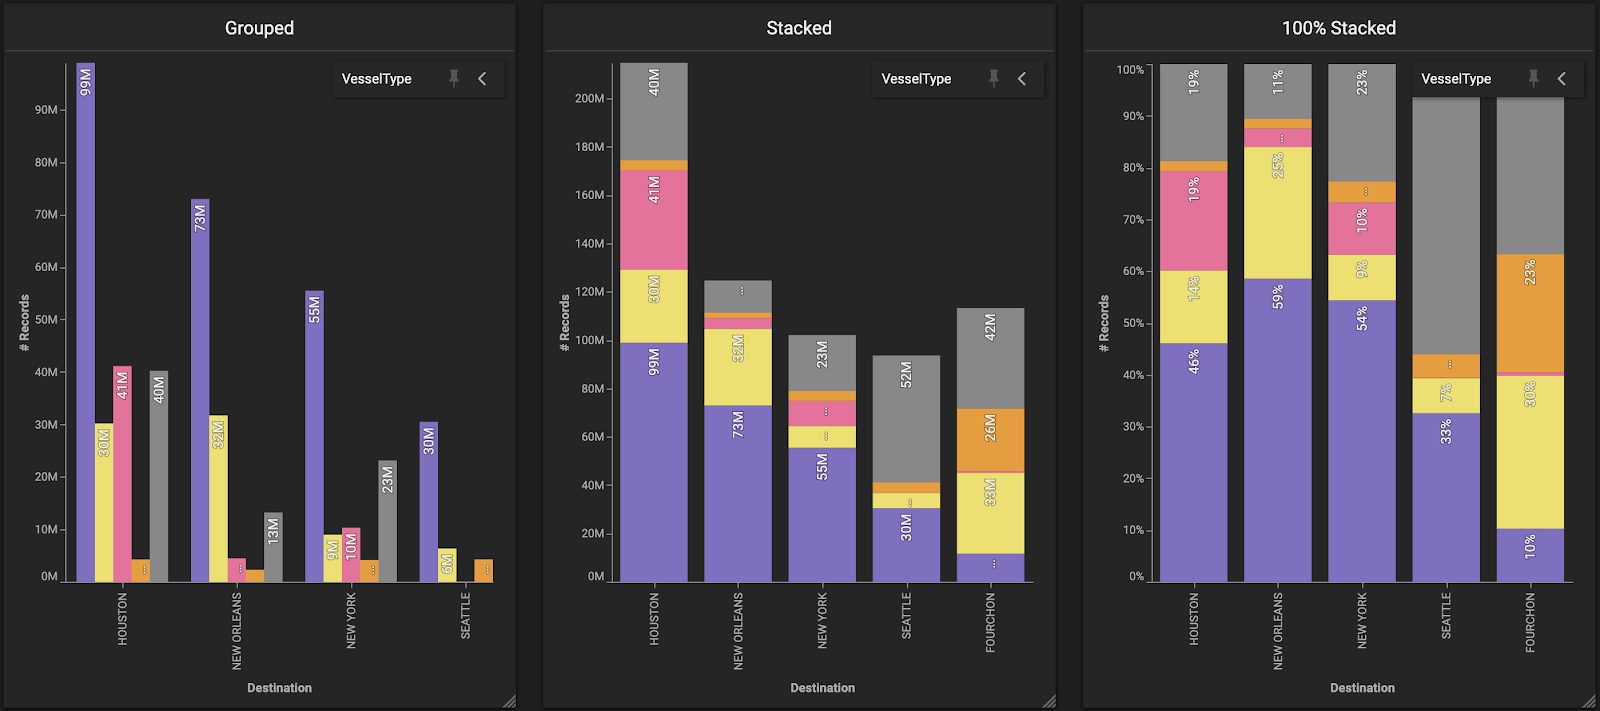
Similarly, Column charts with additional group-by-dimension can be visualized as grouped, stacked and 100% stacked charts.

Line/Area charts that are split by another group-by-dimension can be visualized as grouped lines, stacked area and 100% stacked area charts.
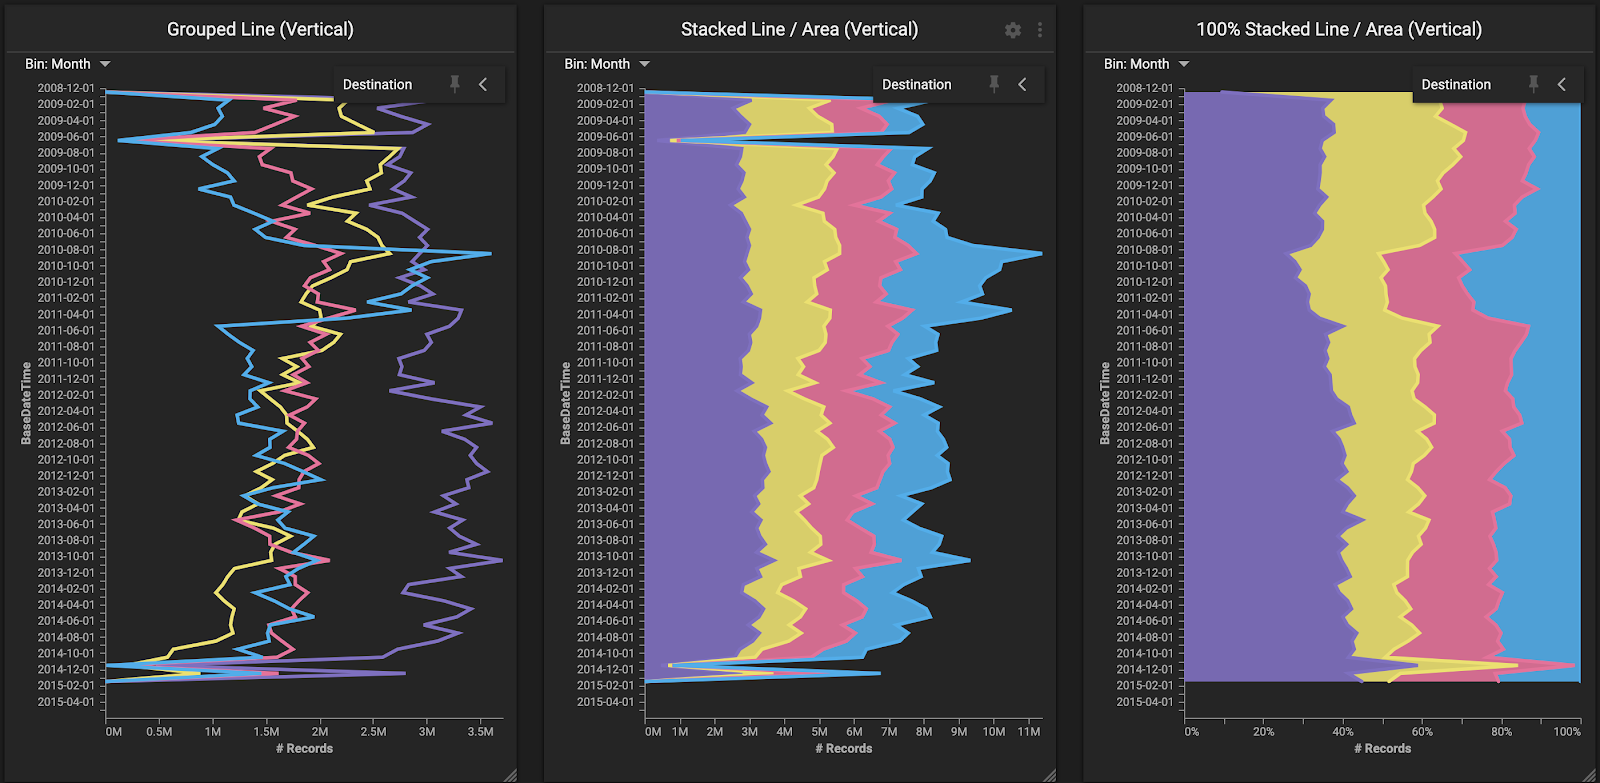
These Line/Area charts can be arranged vertically to better analyze certain chronological data.
3 - Cumulative & Percentage Distribution

There are many cases where we need to analyze data in cumulative form instead of a typical histogram, for e.g. Purchases made by different age groups.
Similarly, instead of analyzing absolute values, you might want to understand the percentage distribution of values across the dimension, for e.g. Transactions distribution over time.
These were the top two asks by our customers. Now, with 5.3 you turn on cumulative distribution, percentage distribution or both.
4 - Multiple layers in combo chart

New Combo brings in the capability of adding multiple layers to the chart. These layers can point to the same or different datasets. Now, without pre-joining datasets, you can interactively analyze data from disparate sources.
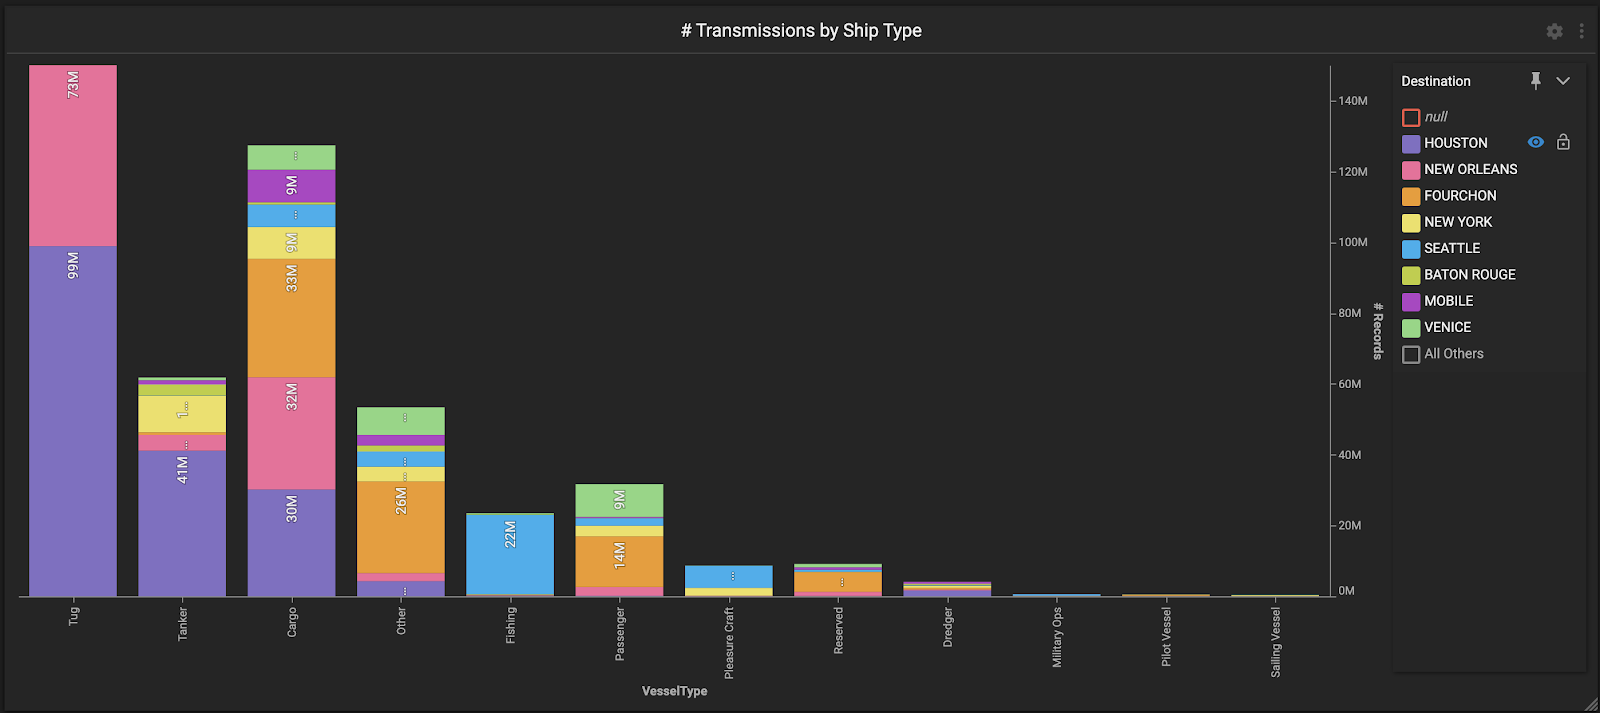
5 - Filter for Top N dimension values

Users can do advanced analytics by using the new ‘Top N’ experience. For charts with a group by dimension, OmniSci will dynamically select top N dimension values. The user can manually select/deselect certain values as well as configure sorting logic.
6 - Other Interactive Features added to the new Combo Chart
Several other features are detailed in the documentation. Here’s a quick list of some:
- Chart legends can be pinned or superimposed on the chart
- Individual series can be toggled on/off from the chart legend
- Min/Max of axis can be independently locked
2 - Filter Experience
OmniSci 5.3 introduces a couple of new filter components to improve interactive exploration of data:
- Chart-level filters
- Updated UX/UI for dashboard filter panel
- Simple dashboard filters
Let’s visit some of these features in detail.
1 - Chart-level filters
Cross-filtering is one of the most powerful tool to perform associative explorative analysis within OmniSci. But, to up our game one more in the filtering realm, we’ve added an often-requested feature - chart-level filters.
Customers will love the additional flexibility of the ability to filter results within a chart.
Chart-level filters can be defined through the completely overhauled filter UI in the chart editor mode. These will then surface as chart-level filters on the dashboard. In addition, if the filter operator is an exact match, it will enable a top notch/drawer below the chart title for additional interactivity. Here’s an example of how useful these are in comparisons.

2 - Redefined UX/UI for dashboard filters
Filter panel on the dashboard received many usability updates based on customer feedback. This new filter panel is simple, compact and user friendly.
- Filter panel UI is now invoked via a more familiar slide in/out tray.
- Filter set UI is now a dropdown option menu.
- Setup options have been simplified.
2 - Simple dashboard filters

Finally, we added a ‘simple mode’ to filters. This allows the user to interact with the filters in a more natural interface. For example, numeric filters become sliders while lists are directly highlighted.
3 - Interactive Map Exploration
As you know, location intelligence is one of our core value pillars. To that front, we keep innovating on our mapping engine and interactions. Here are a couple of additions that we shipped with 5.3:
- Linked Pan/Zoom
- Multi-resolution Zoom
1 - Linked Pan/Zoom
One of the often-requested (and very handy) feature that we added is the ability to synchronize panning/zooming across multiple maps. Linking/unliking is done via an icon on the chart title.
2 - Multi-resolution Zoom
Next, we added another long-standing feature request to specify zoom levels in multi-layer maps. Now, the right data corresponding to each zoom level can be setup for each map layer.
Please check out our overhauled documentation for further details on all these new features. Additionally, starting with 5.3, you will be able to watch short explainer videos of these features & a brand new what’s new page on our website. So, stay tuned for these!
OmniSciDB
Shifting gears, OmniSciDB continues to push forward with continued focus on performance and stability as a key theme.
1 - Performance Improvements
5.3 includes performance improvements on CUDA GPUs, particularly Volta and Turing.
- Aggregate workloads perform better due to the PTX code generated by the query compiler targeted at specific GPU architectures.
- Aggregations on double precision types has increased by 10x in some instances.
- Query engine can leverage GPU shared memory in additional scenarios resulting in performance improvements on aggregate queries in the presence of a group by.
2 - Stability Improvements
OmniSciDB saw several major improvements in stability:
- In low memory situations, significant classes of errors have been eliminated that would typically occur in high memory-pressure situations.
- With our impending move to the Vulkan API for our rendering foundation, expect further improvements, as Vulkan grants finer-grained control over rendering-generated allocations than our existing OpenGL-based approach of handling GPU memory-usage.
3 - Other improvements in OmniSciDB
OmniSciDB added support for array types in JDBC, and support for SELECT DISTINCT with UNION ALL queries (Note that UNION ALL is still pre-release as of 5.3).
Wrapping Up
A big shout out to the product-engineering teams for landing key, longstanding features amidst all the ongoing uncertainties. As always, you can get OmniSci 5.3 from our downloads page, and read the updated documentation and release notes. We’re looking forward to your valuable feedback and hope to delight our customers even more with upcoming releases this year.


