

Release feature focus: Being smart, not dense, with Immerse Density Gradients
Try HeavyIQ Conversational Analytics on 400 million tweets
Download HEAVY.AI Free, a full-featured version available for use at no cost.
GET FREE LICENSEThis week we release version 3.1 of MapD, which comes after some truly giant news over the last few weeks, and adds a number of useful new features.
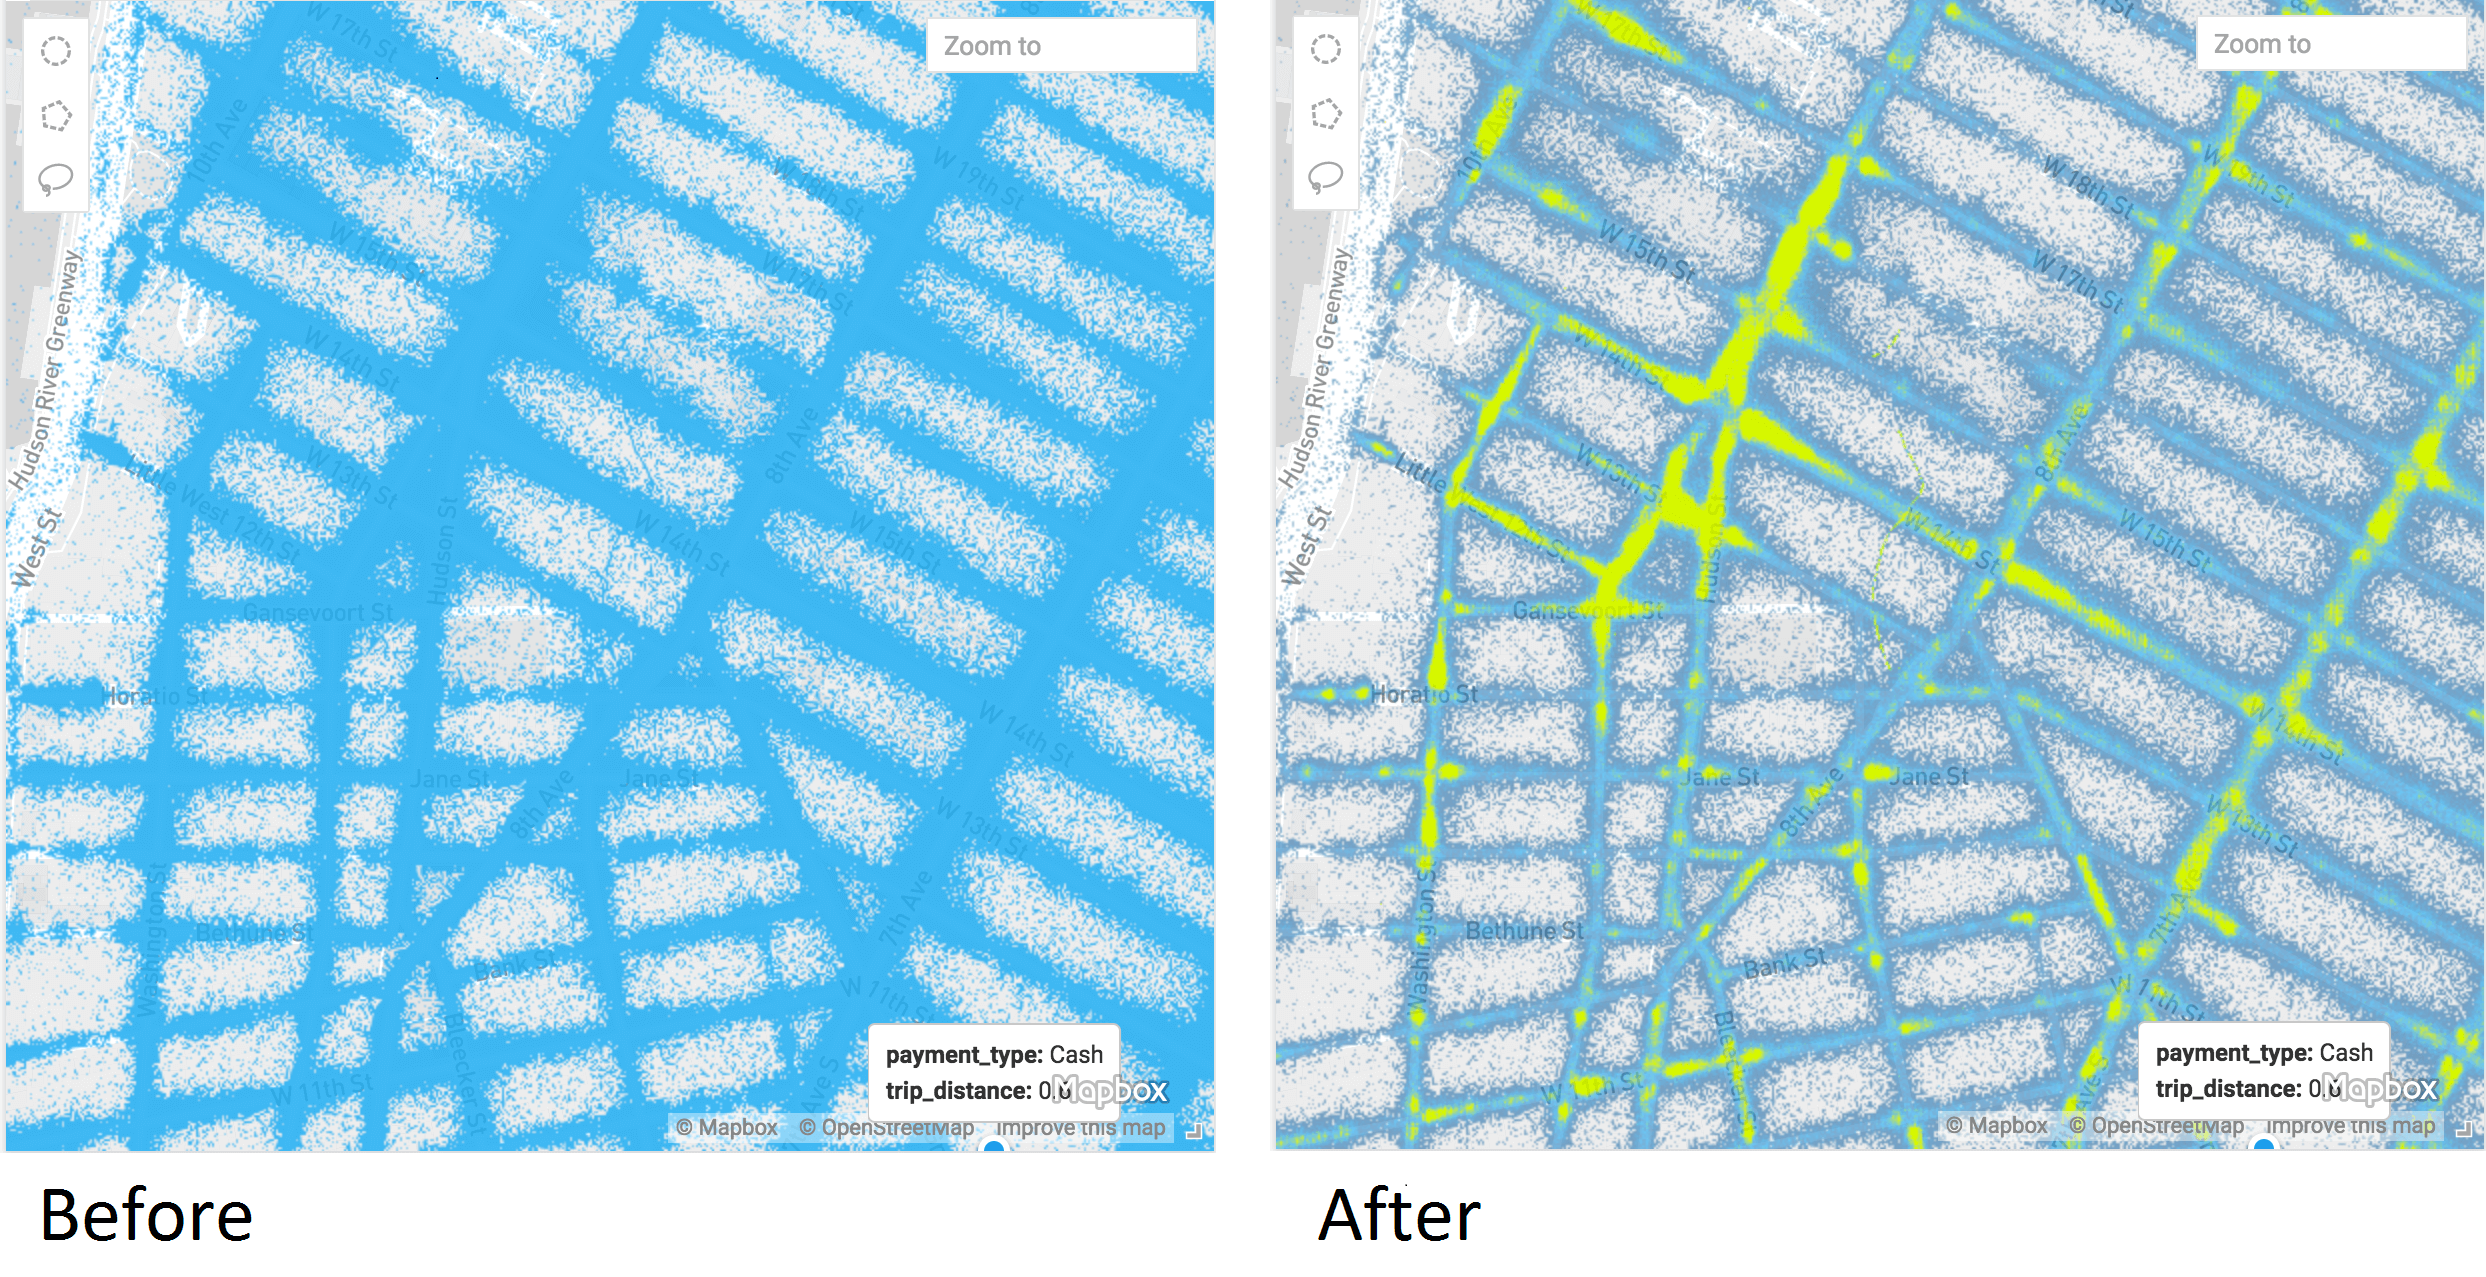
First, we’ve brought into Immerse a feature from the MapD Core Rendering Engine called Density Gradient, which helps you spot areas of concentration when you’re looking at visualizations of big data. For example, let’s say you’re looking at the New York City street grid and trying to find the heaviest areas of taxi drop-offs. Beforehand you would have seen a sea of points on the map, but Density Gradient lets you clearly spot the corners which are busiest, for example the meatpacking district below:
In another example from the other side of the Atlantic, see how airplanes approaching Heathrow Airport in London appear to be kept in 4 oval holding patterns before approaching the airport’s runways along two narrow parallel corridors:

Density Gradients are useful on non-geographic plots as well, such as scatterplots. For example consider the scatterplot below, which shows the length of ships on the X-axis and the width of ships on the Y-axis. As you'd expect you can see a correlation between the two measures at lower left, but then we see an interesting anomaly towards upper right, where a flat line extends rightwards at 32 meters width. This is the Panamax Width, the widest width for a ship to be able to navigate the Panama Canal, which many ship designers limit themselves to.

Density Gradients have the fun side-effect of sometimes making for images that are not just informative, but beautiful as well. Check out the paths of boats emanating from the fishing town of Ucluelet, British Columbia, to chase after schools of fish:

Along with Density Gradient, in this release Immerse introduces Mapbox basemap themes, so you can use a satellite theme to check your data’s proximity to visual landmarks, or choose a dark theme as shown in the fishing boat dashboard above.
3.1 brings other improvements as well, too numerous to go into in detail, but some quick highlights include:
- Significantly faster performance on cold queries by more fully utilizing available PCIE bandwidth. Your mileage will vary based on your hardware, but on some of our machines internally we saw 3x improvements for queries which require an initial fetch of data from disk.
- Support for correlation (CORR) and covariance, for folks who want to study how one column of data moves in relation to another. Still working on a “causation” function ;)
- The addition of support for GPU data frames (announcement), part of the GPU Open Analytics Initiative (GOAI), which allow for the efficient sharing of data between programs on the GPU without the typical need for data transfer. This is available via the Thrift API endpoint sql_execute_gpudf.
- Support for capping chart axes and editing axis labels, so that you can use friendly names where needed, and cap the height of the chart to exclude outlier data from view.
Full details available in our release notes. Also, remember the software is available to download to check out for yourself.


