

Where should Amazon Move Next?
Try HeavyIQ Conversational Analytics on 400 million tweets
Download HEAVY.AI Free, a full-featured version available for use at no cost.
GET FREE LICENSEAmazon has been very vocal about its selection criteria for its 2nd headquarters. Since the request for proposals was released on September 7th, there has been a buzz across North America about the best location for this second headquarters. Amazon will announce the winning city in 2018, and cities across the country are vying for this honor. Amazon has reported that its investments in Seattle, its first headquarters city, have generated $38B to the city’s economy since 2010.
In today’s world, data is more available than ever before and companies of all sizes and types use U.S. Census data to reach decisions that allow them to operate more efficiently. Amazon received 234 bids from 54 states and the company has a tough decision ahead. Perhaps Amazon needs to look no further than this census exploration application built by MapD, to determine where to place their HQ2.
Amazon has publicized some factors that will influence the decision on their second headquarters, such as: proximity to a metro population with a million or more residents; a location close to an International Airport and a highly-educated workforce with relevant experience and average annual total compensation exceeding one hundred thousand dollars ($100,000).
So, let’s take a look at the MapD US Census demo.

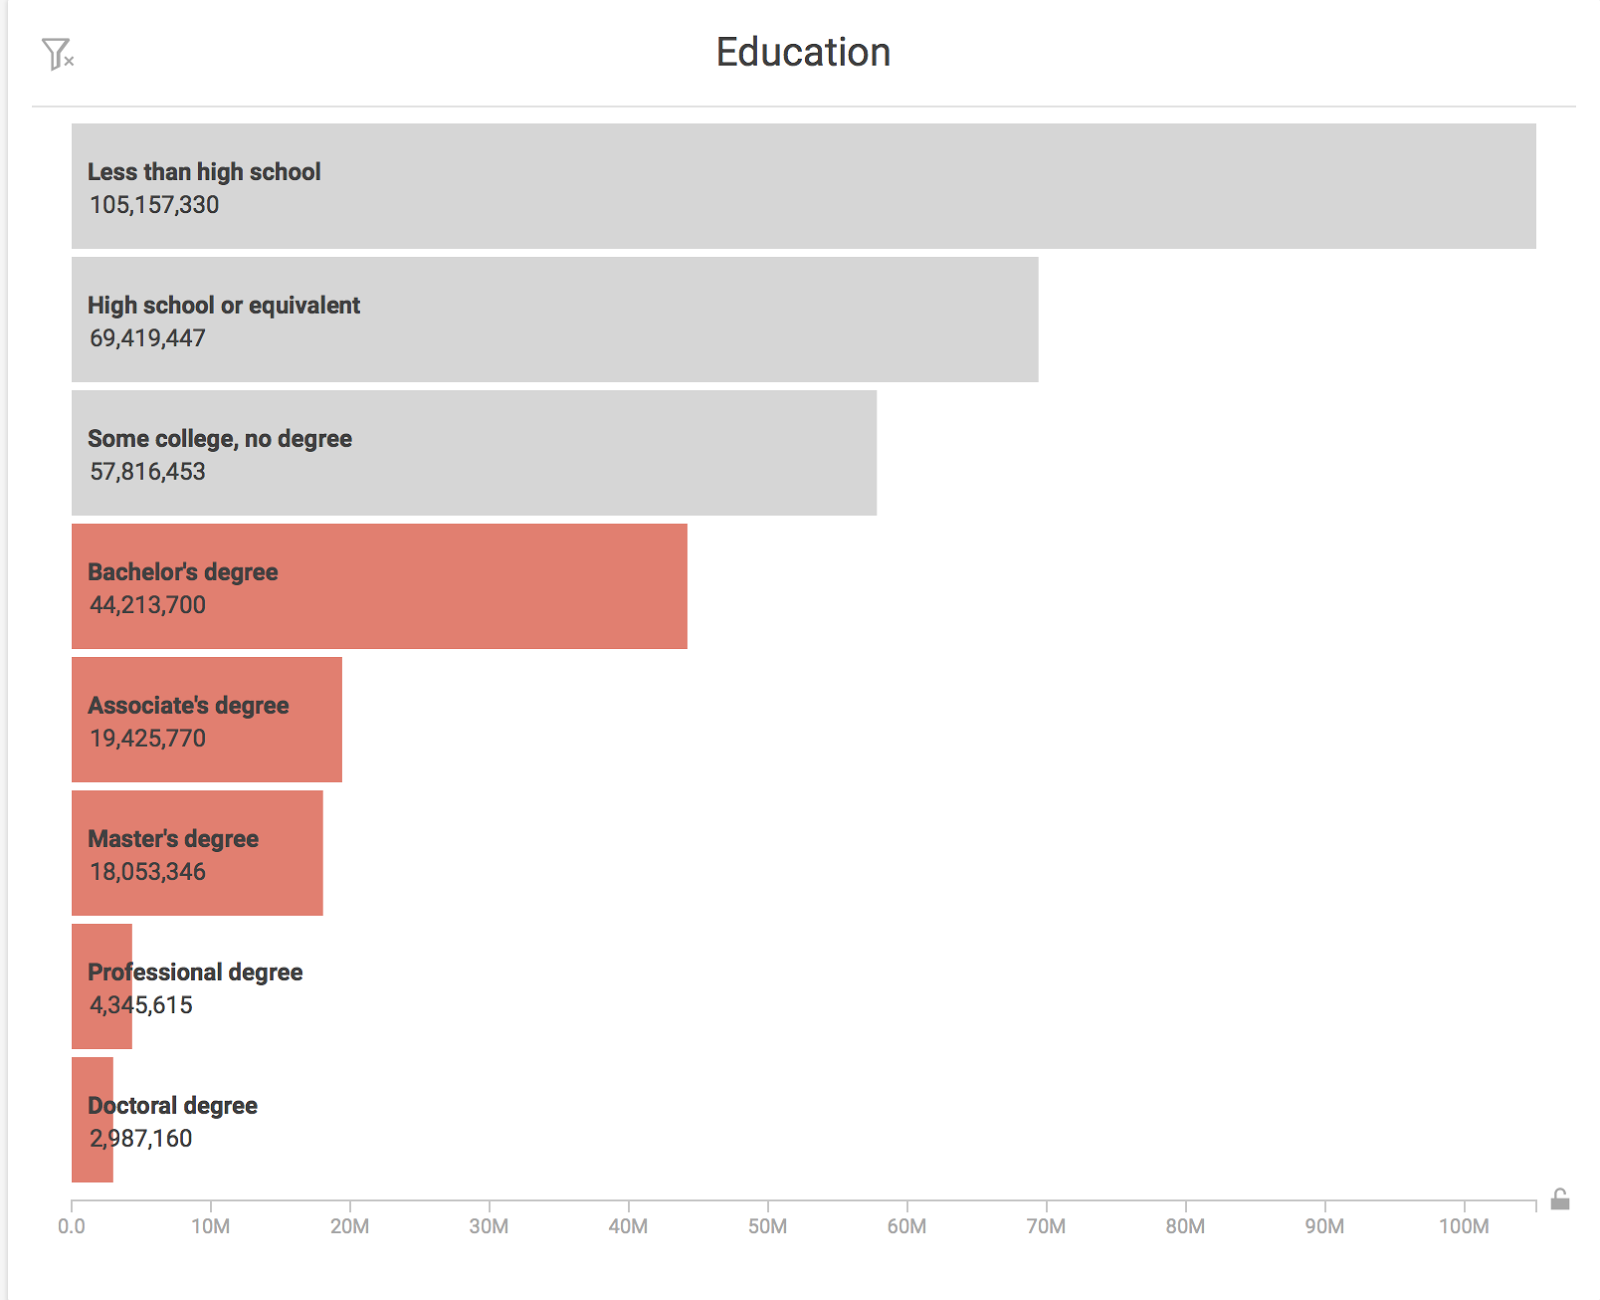
First let’s filter on Education. If we filter on Bachelor’s Degree, Associate Degree, Master's Degree, Professional Degree and Doctoral Degree we see that New York, Texas and California have the highest concentration of these degrees.

Next, we can assume that Amazon would like to hire a certain percentage of Military Veterans. (select Veteran). Interestingly we can see the data change and Florida has 600,000 Veterans that fit Amazon’s education requirement and are also Veterans. But if we now click on the state of Florida and look at the “Age” chart, you notice the Age demographic for highly-educated veterans in Florida shifts considerably towards typical retirement age. At least half of these folks are probably enjoying retirement rather than looking for employment with Amazon.
Let’s filter the Age range from 20-60, to reduce the number of retirees.

So the data is now showing us that Texas, California and Virginia best meet these criteria: highly-educated veterans between the ages of 20-60.

Now if we look at the Occupation table we can see that these 3 states have large numbers of managers and computer scientists.Both seem to be roles that would be important for Amazon’s hiring pool.

While the speculation continues about which city Amazon will choose, cities across the country wait to see if they’ve been selected as a finalist. Amazon could use the MapD application to further differentiate between the finalists, add in other types of analysis and choose the winner based on the data that meet its strategic objectives.
Using MapD, we just explored one perspective on a dataset of 38 million records in real-time. That fast exploration can give Amazon a good idea of where they might want to focus their efforts for HQ2. Only MapD allows decision-makers to explore a dataset of this size with immediate visual feedback on the relationship between the data elements. Because MapD leverages the parallel processing power of GPUs, it gives analysts interactive speed on all the data, eliminating the need to index, cube or otherwise pre-aggregate the data. When you filter on one attribute in the dashboard, each chart issues a SQL query against the backend, scanning the 38 million records in milliseconds for unprecedented interactivity.
Amazon has an important decision to make. It will affect the lives of millions of Americans. But MapD makes this US Census data publicly available to anyone who visits our Demos page. Are you a home-builder deciding where you want to break ground? Are you a public health professional planning a new program to fight disease? Or are you a government official investing in new infrastructure? Regardless of your interest in census data, we invite you to explore MapD for a new type of analytics that will transform your industry


