

Installing MapD Charting
Try HeavyIQ Conversational Analytics on 400 million tweets
Download HEAVY.AI Free, a full-featured version available for use at no cost.
GET FREE LICENSEFirst, clone the repo to your local workstation and refer to platform-specific tips.
https://github.com/mapd/mapd-charting
Mac OS X

Overview
Easy install. No problems. Very few external dependencies.
npm install #downloads all dependencies and devDependencies
npm install mapbox-gl@https://github.com/mapd/mapbox-gl-js/tarball/9c04de6949fe498c8c79f5c0627dfd6d6321f307 #downloads mapbox peer dependency
npm run start
Community tested configurations
- Node v6.11
- Mac OS X 10.12.5
- Xcode from Apple App Store
Linux

Overview
Easy install if you use node 5.12.0. Set your node version with
nvm or n.
Community tested configurations
- Node 5.12.0
- Ubuntu 17.04
Windows 10

Overview
You'll need to install some additional programs and libraries. Works great after you install these components:
- Bash to run script npm run start (which you probably have installed with git bash)
- Windows SDK 8.1 (you need this version, not Windows 10 SDK)
- You may also need to install Visual Studio for the build tools
- Node 7.x or below (not node 8, which is the most recent version)
- Python 2.7x 64 bit
In addition to the components above, you should also install the following manually
from the command line:
- install node-gyp globally (You'll see it in the warnings. npm install -g node-gyp)
- install node-sass manually (npm install node-sass)
Tips
As the PATH on git bash and the DOS command prompt are different. You may need to run
some of the scripts from either DOS or Powershell. You need to run npm run start from bash.
Community Installation Notes
Vagrant Dev Containers

Vagrant is popular with developers and people involved in DevOps. It
allows you to install MapD Charting inside a Linux VM and use development
tools on your workstation. For example, you can install MapD Charting on Windows
inside of a Linux VM and then use Visual Studio on Windows to develop a MapD
Charting application.
Install Steps
- Install VirtualBox
- Install Vagrant
- Copy Vagrantfile into your development folder
- Provision MapD Charting VM with vagrant up
- ssh into VM with vagrant ssh
- cd in /vagrant/mapd-charting/ and run npm run start
Install Tips
On Windows, you must run the Command Prompt as Administrator.

After you ssh into the VM, your files will be in /vagrant/mapd-charting.

The install with vagrant up takes 10-20 minutes. The installation script will appear to
have no movement during several sections.
Cloning the mapd-charting repository took 4 minutes. There's no status report from the
script during this stage. It will look like the screen below for 4 minutes.

There will be many messages that say, WARN. You can fix these laters when you're
developing your application. The warning messages did not appear to impact the demos. The script stayed on the screen below for several minutes before moving on. There is no status update during that time.

Accessing Linux Files from Windows
Files placed in /vagrant/ inside the Linux VM will be visible from
inside the Windows directory you started Vagrant from.

You can now open your MapD Project folder in an IDE such as
Visual Studio 2017.

Browser Access to MapD Visualization Projects
Use the browser on your workstation. For example, point Microsoft Edge
on Windows to http://127.0.0.1/example/.

In this workflow, you are using your Windows IDE and your Windows browser to
edit and view the MapD Charting application running on Linux.
Once the application is ready for public testing, move it to something
like AWS running Linux.
For more information on Vagrant configuration and workflows, refer to
the Vagrant documentaion.
Windows Subsystem for Linux
Microsoft designed their Windows Subsystem for Linux for with web developers working on server side applications. This method avoids the
performance hit of a VM and allows you to install MapD Charting using Ubuntu 16.04 applications that talk to the Windows kernel.
Prerequisites
- Windows 10 64 bit
- Developer Mode enabled
- Windows Subsystem for Linux — Install guide from Microsoft
At the Command Prompt, type bash.

Note: if you don’t see a bash shell, go back and read the WSL install guide from Microsoft. There are also some tips at the end of this article.
cd into a development folder you can access from Windows.
clone mapd-charting repo into your development folder with
git clone https://github.com/mapd/mapd-charting.git
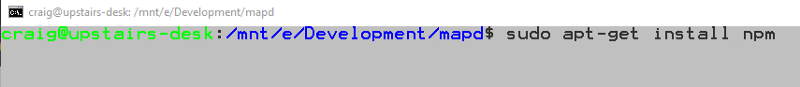
Install npm with
sudo apt-get install npm
install n using npm.


Although your experience may be different, I had some problems with
permissions when I tried to use n to install node 5.12. To solve this,
I used bash as root temporarily to install a specific version of node with n. When I do the install, I’m going to include n in the PATH.

NOTE: /mnt/e/Development/ is the directory of my Windows E: drive that I do development in. /node_modules is the folder that npm installed n into.
Install node 5.12 with this command:
n 5.12

Exit bash running as root.

cd into mapd-charting and install it with npm.
npm install

There will be a few warnings. This is fine. After the install finishes, install the peer dependency in
mapbox-gl-js.


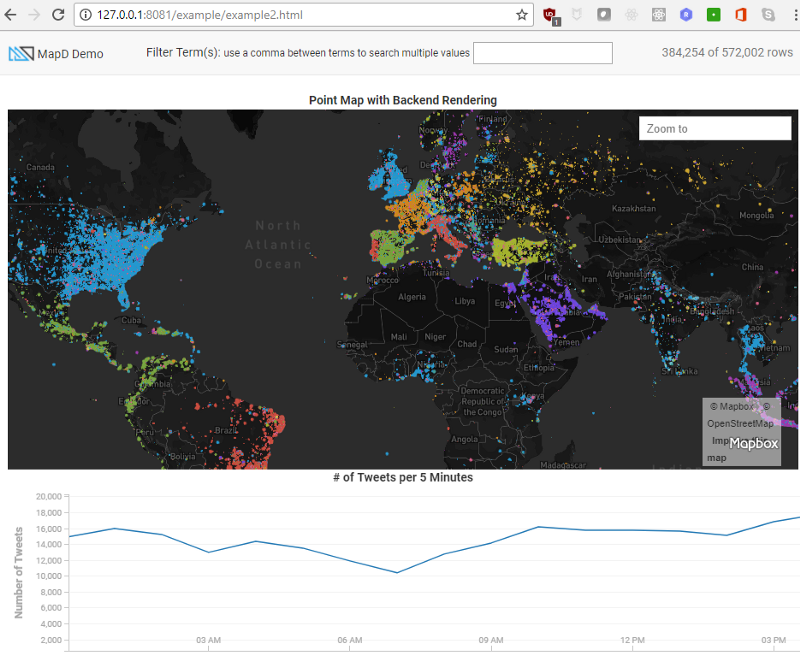
Start the MapD Charting demos with:
npm run start

You can now access the demos from your web browser:
http://127.0.0.1:8081/example/
Open up an editor like VS Code, Atom, or Sublime and start editing the demos to get more
familiar with the MapD Charting API.

Additional Install Information
I’m installing Windows Subsystem for Linux from Powershell, not from the Microsoft store.
Set your computer to Developer Mode.

Run bash at the command prompt. It will install Windows Subsystem for Linux.

Contributing to MapD Community Tips
Please add or edit this document. Do not be shy. We're just trying to create cool things with MapD and any contribution will help.
To edit this document, go to the Edit on GitHub button in the upper right.

The community docs are on GitHub. You will need to fork the repo and submit a pull request.

Edit the file in Markdown.
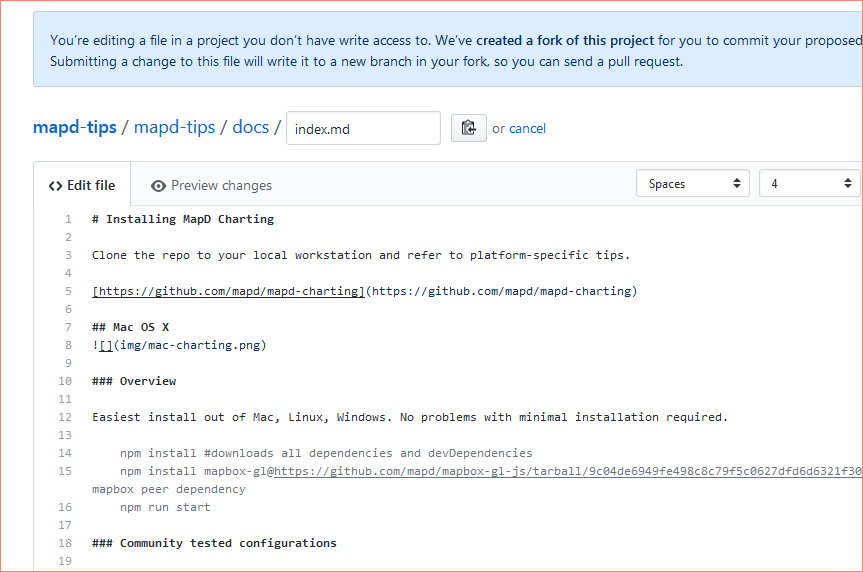
Propose the change. Do not back down.
We will be happy to hear from you. If the change is in error, either we'll help you to fix it or the community will help. Press the button. Do it.

Create the pull request.


Change to main document will be incorporated after a human being reviews it. Please join us on the Community Forum if you have questions or would like to share your charting experience with other developers: http://community.mapd.com. Thank you.


