
Plotly Dash and OmniSciDB for Real-Time Data Visualization
Try HeavyIQ Conversational Analytics on 400 million tweets
Download HEAVY.AI Free, a full-featured version available for use at no cost.
GET FREE LICENSEOver the past year, the OmniSci F1 Demo has traveled to conferences and meetups all over the United States. By allowing attendees to drive a few laps in an F1 video game and see vehicle telemetry results streamed into OmniSciDB, the Community and Events teams can demonstrate the full power of the OmniSci platform in a highly-engaging manner.
The data engineering part of the F1 demo, which used StreamSets Data Collector along with omnisci-jdbc, was explained in detail in the post "Creating the OmniSci F1 Demo: Real-Time Data Ingestion With StreamSets". In this post, I’ll walk-through how I created the real-time dashboard using Plotly Dash and outline a few things to keep in mind when using OmniSciDB as a data source for a custom app.
All of the code explained in this blog post is available in the F1 Demo GitHub repo.
Flask + Bootstrap + React.js = Plotly Dash
The Python community hasn’t coalesced around a single open-source project in the same way as the R community has with Shiny, but Dash feels similar in its design and goals. User-friendly features such as templated and grid layout options are available via Dash Bootstrap Components and interactivity is available by default, since Dash is built on React.js. The biggest advantage for me in choosing Plotly Dash is that it’s built upon the Python web framework Flask, which I already had experience with.
Laying out the F1 dashboard takes only a few lines of code, similar to a plain Flask app:
The F1 dashboard can be thought of as two sections:
- the navbar which holds the app title and company branding and
- the body, which is comprised of two rows, each having two columns to hold the visualizations.
I chose to use placeholder variables for navbar and body instead of building the actual widgets into the layout. This allowed me to work on the four sections separately, instead of having all of the Dash code nested inside the same app.layout assignment.
Calling OmniSciDB to Populate Visualizations
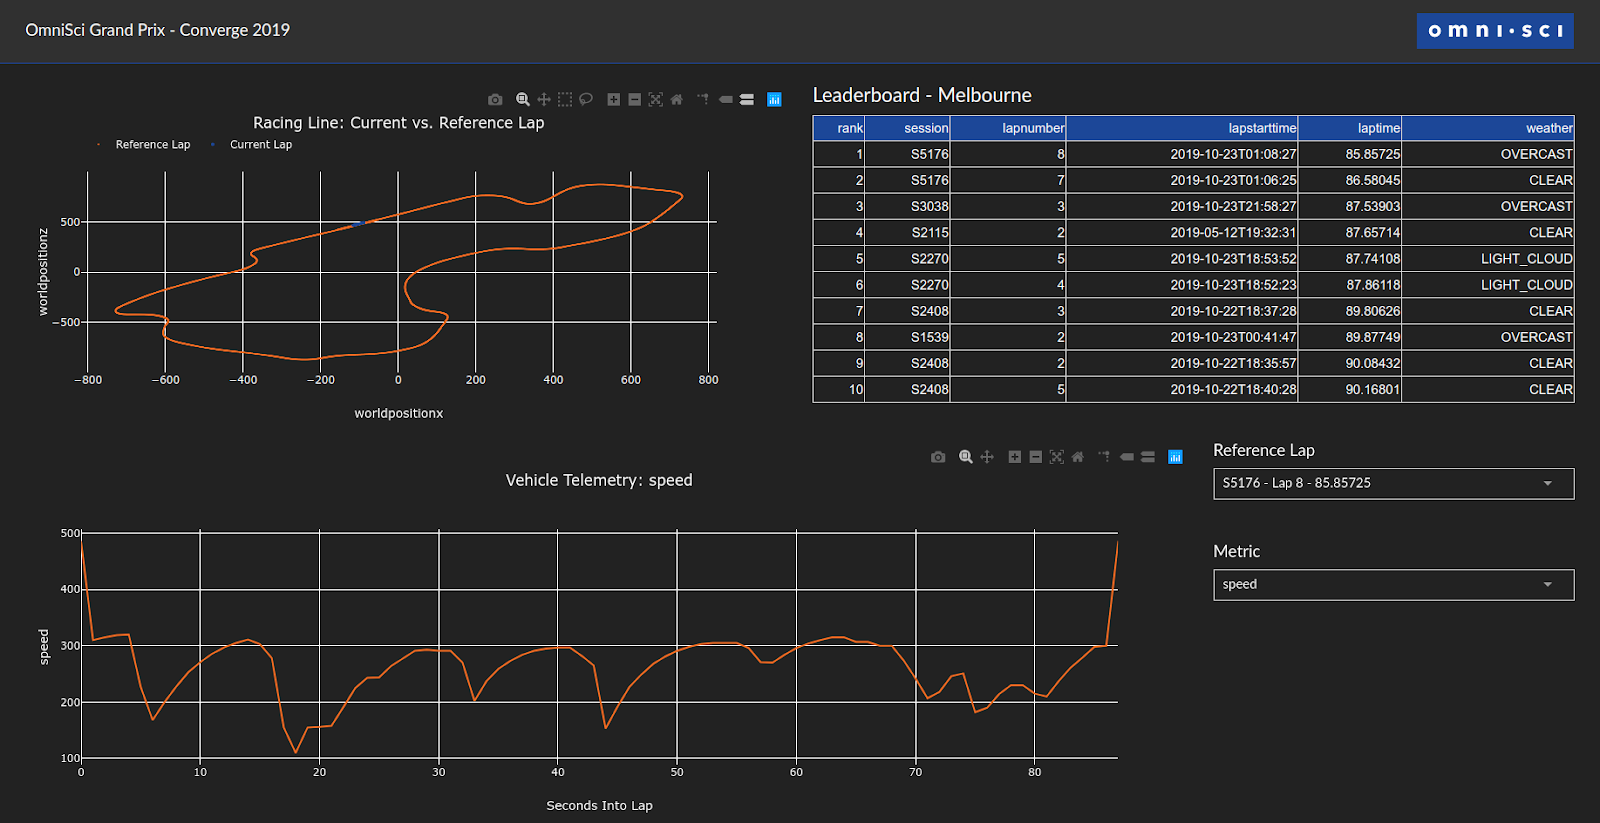
While Plotly Dash provides all of the functionality for creating and laying out the visualizations on the dashboard, the computationally-intensive portion of the app is handled by OmniSciDB. There are four main queries that power the dashboard, one for each of the widgets (not including the Metric drop-down widget, which is statically populated):
- Populating the leaderboard with the 10 fastest laps
- Getting the track position (scatterplot)
- Getting vehicle telemetry (line chart)
- Populating reference lap drop-down (top 50 fastest laps)
Each of these queries are written as Python functions, using pymapd to talk to the OmniSciDB backend. Let’s explore get_telemetry_data():
This function has a couple of inputs, which helps to uniquely identify and retrieve the telemetry data from a specific lap. In the function body, you’ll notice that I embed the pymapd.connect() call inside of the function instead of passing a Connection object as an argument to the function. While hammering a database with a new connection every few seconds isn’t the best development practice, it does guarantee a “fresh” connection every time a new query is submitted. I’ll talk more about performance considerations of this entire app later in the post, but for the intended use of the app as a single display in an event booth, creating a new connection on every query is more than performant enough.
Reactive Programming Using Dash Callbacks
The interactive capabilities of the F1 dashboard are created using callbacks in Dash, which are implemented as Python decorators. Decorators allow Python functions to be modified with additional behaviors, without actually changing the underlying Python function. Dash callback decorators have inputs and outputs; changing the input (usually, a menu element) will re-run a Python function, modifying a specific element on the page (also defined as part of the callback).
On-demand Dash Callbacks
The first way Dash callbacks are used in the dashboard are the drop-down menus for setting the Reference Lap to compare against the current driving performance and Metric for choosing a telemetry metric to monitor. You can see both how both inputs work in the build_telemetry_chart() function; to keep the explanation from being too overwhelming, we’ll just look at the decorator and function signatures here:
Lines 6 - 28 of the code snippet above define the drop-down menus. The important thing to notice about these lines are the id fields; these labels define what the overall Dash application will be observing for state changes. When either of those drop-down menus change their value field (which happens when the user interacts with the interface), they send a signal to build_telemetry_chart() that it needs to be re-run. When build_telemetry_chart() is finished running, it returns its output per the Output location defined in the callback (which for this example is the id telemetry-graph in the telgraph Python object). An important concept to understand about callbacks in Dash is that the id value is the same id concept as in HTML, a unique identifier in a web page. Although Dash is running via Python, and telgraph is our Python object, the callback reference by id is a pass-through to React.js to tell it what part of the web page to update.
Time-based Dash Callbacks
On-demand Dash callbacks add interactivity to dashboards, but to make a real-time updating dashboard, we need to periodically refresh the data that backs the charts without user intervention. Using the Interval class from the Dash Core Components library, we can set any time period we choose to trigger a callback:
Within the trackgraph Python object, I added an Interval that updates every 7000 milliseconds to update the track-interval id. You’ll notice in the callback.py embedded snippet above, the first value in the Input array is Input('track-interval', 'n_intervals'); every 7 seconds, the dcc.Interval() code fires, which tells the build_telemetry_chart() function that it needs to run, which then updates the telemetry-graph id.
Controlling UI elements in this manner might seem confusing, since it’s much more JavaScript than Python! But callbacks are what allowed us to build the following logic into the application: “Update the telemetry-graph if 1) the Reference Lap is changed and/or 2) the Metric is changed and/or 3) 7 seconds have elapsed.” So while callbacks in Dash can be confusing, callbacks are super powerful and worth taking the time to learn.
Controlling the Loading Order of Plotly Dash CSS
Once you have the layout of your dashboard and have added interactivity, what is actually shown in your dashboard widgets are a matter of the story you’re trying to tell and your design sensibilities. I’m not going to cover every design decision that I made, or how I modified the Darkly theme to have OmniSci branding colors, but the Dash documentation and user forums should provide all of the answers you are looking for.
One thing that did trip me up as I was trying to style the dashboard was that my CSS changes kept getting overwritten by the base CSS styles from the React components loaded by Dash. The way I overcame this was to use app.index_string to control the loading order of the files:
By placing the {%css%} tag last in the footer, I was able to ensure that my CSS changes didn’t get overwritten by any of the default CSS classes for Dash. My custom CSS as part of the assets/external.css file is now the last thing loaded on the page, and thus, those CSS definitions are what is shown in the app.
Moving From Flask Dev Server to a Production Server
After completing the Plotly Dash app, I decided to heed the Flask warning about not using the development server for production work. I used gunicorn and 8 threads, but since this app was only running in one location at a time (i.e. the event booth), it’s likely that I could’ve used fewer. The installation steps for how to run a Dask/Flask app are beyond the scope of this post, but the official documentation for Flask as well as the DigitalOcean Flask guide made the process pretty effortless.
One decision critical to this specific Plotly Dash app was running the app on the same server as OmniSciDB and using multiple GPUs. By using a larger GPU server (an ND24s instance on Microsoft Azure, 448GB CPU RAM / 96GB GPU RAM) and running the Plotly Dash app from that same server, it both removed network latency as well as gave OmniSciDB a considerable GPU memory buffer to keep data ‘hot’. No matter what combination of reference laps and telemetry metrics users explored, the maximum GPU RAM used by the app was roughly 30GB, leaving plenty of server capacity as additional laps expanded the telemetry datasets.
Let’s See Your Custom Dashboards!
In my two OmniSci F1 Demo posts, I’ve shown that it’s possible to insert a real-time data stream into OmniSciDB using StreamSets and also to use OmniSciDB along with Plotly Dash to create a real-time dashboard. Both the data engineering and real-time dashboard use cases are possible due to the architecture of OmniSciDB, which does not require creating indexes to get performant queries. As soon as the data is ingested into OmniSciDB, and that data can be transferred from CPU RAM to GPU RAM, the data is available for use.
For OmniSciDB (open-source) users, a framework like Plotly Dash can provide a near Immerse-like analytics experience. The only things you might miss are some of the advanced features in Immerse like automatic cross-filtering between charts and backend rendering (and of course the no-code nature of building a dashboard). But Enterprise Edition users can also get value from a custom app approach; with the infinite flexibility of React.js, all of the other amazing libraries available from the JavaScript and Python communities and the power of OmniSciDB on the backend, multi-billion row interactive data visualizations are easily available to all!
Have a question or comment on this post? Have you built a custom dashboard on OmniSci? Please stop by the OmniSci Community Forum and let us know what you think!


